For the better part of the last two years, it’s been all systems go for bulls on Wall Street. Since the start of 2023, the iconic Dow Jones Industrial Average (DJINDICES: ^DJI), benchmark S&P 500 (SNPINDEX: ^GSPC), and growth stock-powered Nasdaq Composite (NASDAQINDEX: ^IXIC) are higher by 25%, 47%, and 69%, respectively, as of the closing bell on Sept. 13, 2024, and have all hit multiple record-closing highs this year.
While there’s little question that a resilient U.S. economy, along with investor euphoria surrounding artificial intelligence (AI) and stock splits, have driven equities higher, it’s important to understand that stocks can and do move in both directions.
According to investing great Warren Buffett, “Be fearful when others are greedy. Be greedy when others are fearful.” The time to be fearful has officially arrived for Wall Street and investors.

The Federal Reserve is about to cut interest rates, and that’s historically bad news for stocks
On the surface, things appear to be going swimmingly for the U.S. economy. Gross domestic product is expanding, the unemployment rate is still near historic lows, and the prevailing rate of inflation is inching closer to the Federal Reserve’s long-term target of 2%.
But logic doesn’t always play out as you’d expect on Wall Street.
On the surface, a rising-rate environment would be viewed as bad for businesses and economic growth since it makes borrowing costlier. Conversely, a rate-easing cycle is typically seen as a positive for companies, with lower rates reducing the cost to service debt. But if you take a step back and look at the bigger picture, you’ll often find that the reaction of stocks is opposite to this thought process.
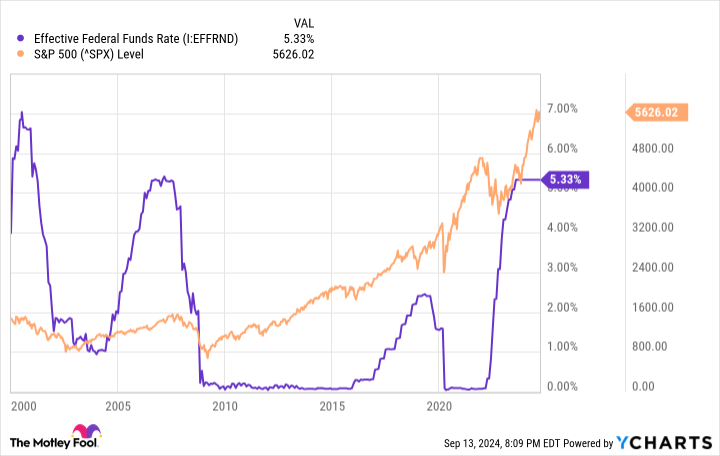
The nation’s central bank doesn’t alter monetary policy on a whim. It typically does so in response to changes in a multitude of economic data points. When the Fed raised its federal funds rate by 525 basis points beginning in March 2022, it did so to keep the U.S. inflation rate from getting out of hand with the U.S. economy firing on all cylinders.
On the other hand, rate-easing cycles are often undertaken by the Fed when one or more data points are amiss with the U.S. economy. The Federal Open Market Committee is widely expected to reduce its federal funds target rate when it meets later this week.
Since this century began, the Federal Reserve has kicked off three rate-easing cycles. Following the start of each cycle, the Dow, S&P 500, and Nasdaq Composite have swooned.
-
Jan. 3, 2001: Beginning in early 2001, the nation’s central bank began a roughly 11-month easing cycle that moved the federal funds rate from 6.5% to 1.75%. Unfortunately, equities didn’t find a bottom during the dot-com bubble until Oct. 9, 2002, some 645 calendar days later.
-
Sept. 18, 2007: With the financial crisis taking shape, the Fed began cutting rates on Sept. 18, 2007. Despite reducing the federal funds rate from 5% to a historically low range of 0%-0.25%, the stock market didn’t bottom until March 9, 2009, which is 538 calendar days after the first rate cut.
-
July 31, 2019: The third rate-easing cycle began shortly before the COVID-19 pandemic took hold. The fed funds rate was quickly chopped from a range of 2%-2.25% to, once again, a historically low range of 0%-0.25%. A total of 236 calendar days elapsed from the first rate cut to market bottom.
During the above rate-easing cycles, the benchmark S&P 500 endured three bear markets that resulted in respective losses of 49%, 57%, and 33% of its value, with the growth-fueled Nasdaq being hit even harder.
What’s more, since this century began, it’s taken an average — I repeat, an average — of 473 calendar days (roughly 15.5 months) following an initial rate cut for the stock market to find its bottom.
Rate-hiking cycles have a history of front-running recessions
In addition to rate-easing cycles leading to poor results for Wall Street, rate-hiking cycles have usually front-run downturns in the U.S. economy.
As you can see in the table below, the nation’s central bank has overseen 13 rate-hiking cycles over the last 70 years.
|
Hiking Cycle |
Total Fed Funds Rate Increase |
Followed by a Recession? |
|---|---|---|
|
Nov. 1954 to Oct. 1957 |
2.70% |
Yes |
|
May 1958 to Nov. 1959 |
3.40% |
Yes |
|
July 1961 to Aug. 1969 |
8% |
Yes |
|
Feb. 1972 to July 1974 |
8.70% |
Yes |
|
Jan. 1977 to April 1980 |
13% |
Yes |
|
July 1980 to Jan. 1981 |
10% |
Yes |
|
Feb. 1982 to Aug. 1984 |
3.10% |
No |
|
Oct. 1986 to March 1989 |
4% |
Yes |
|
Dec. 1993 to April 1995 |
3.10% |
No |
|
Jan. 1999 to June 2000 |
1.90% |
Yes |
|
June 2004 to July 2006 |
4.30% |
Yes |
|
Nov. 2015 to Jan. 2019 |
2.40% |
Yes |
|
Feb. 2022 to July 2023 |
5.25% |
To be determined… |
Data source: Board of Governors of the Federal Reserve. Table by author.
The standout data point from the above table is that 10 of the previous 12 rate-hiking cycles were followed by a U.S. recession. The only exceptions were two increases of 3.1 percentage points in the fed funds rate in 1982-1984 and 1993-1995.
Put another way, any increase above 310 basis points in the federal funds target rate by the Fed since 1954 has eventually (key word!) been followed by a recession. The latest rate-hiking cycle saw the nation’s central bank hike by 525 basis points.
Although the stock market and the U.S. economy aren’t linked at the hip, a shrinking economy does have a strong tendency to adversely impact stock valuations. If the unemployment rate rises and economic activity slows, it’s eventually going to translate into weaker earnings growth, if not a profit plunge, for corporate America.
Historically speaking, roughly two-thirds of the S&P 500’s drawdowns since 1929 have occurred during, not prior to, a U.S. recession.


Be fearful when others are greedy, but maintain perspective
While nothing is guaranteed on Wall Street, the historic correlation between the stock market and rate-hiking/rate-easing cycles would appear to point to meaningful downside to come for equities. Tack on the fact that the stock market has been this pricey on only two other occasions since January 1871, and you have a strong case that a bear market awaits.
Although having a healthy cash position at the ready to take advantage of eventual price dislocations can be a smart move, it’s important to maintain perspective if you’re a long-term investor.
For example, as much as working Americans and investors might dislike recessions, they’re ultimately a normal and inevitable part of the economic cycle. More importantly, they’ve historically resolved quickly. Out of the 12 recessions since the end of World War II, only three lasted at least 12 months, and none surpassed 18 months.
Comparatively, most economic expansions have endured multiple years, with two periods of growth surpassing 10 years. There’s little doubt that optimists have spent far more time in the sun than under gray clouds over the last eight decades.
This same non-linearity to cycles is seen in the stock market.
In June 2023, when the S&P 500 was confirmed to be in a new bull market, the researchers at Bespoke Investment Group released the data set you see above on X, the social platform formerly known as Twitter. Bespoke calculated the calendar-day length of every bear and bull market in the S&P 500, dating back to the start of the Great Depression in September 1929.
Based on Bespoke’s analysis, the average bear market for the S&P 500 has lasted only 286 calendar days, or about 9.5 months, over a 94-year stretch. On the other hand, the typical S&P 500 bull market has endured for 1,011 calendar days, or 3.5 times as long.
You’ll also note that close to half (13 out of 27) of the S&P 500 bull markets have lasted longer than the lengthiest bear market, which stuck around for 630 calendar days, from Jan. 11, 1973, to Oct. 3, 1974.
Although history is quite clear that notable downside is expected for the Dow Jones, S&P 500, and Nasdaq Composite, it’s important to maintain perspective and take a wide-lens approach. Over time, optimism eventually wins out on Wall Street.
Where to invest $1,000 right now
When our analyst team has a stock tip, it can pay to listen. After all, Stock Advisor’s total average return is 755% — a market-crushing outperformance compared to 165% for the S&P 500.*
They just revealed what they believe are the 10 best stocks for investors to buy right now…
*Stock Advisor returns as of September 9, 2024
Sean Williams has no position in any of the stocks mentioned. The Motley Fool has no position in any of the stocks mentioned. The Motley Fool has a disclosure policy.
The Fed Is Set to Cut Interest Rates — the Time to Be Fearful When Others Are Greedy Has Arrived was originally published by The Motley Fool

