For the better part of two years, the bulls have been running wild on Wall Street. In 2024 alone, the iconic Dow Jones Industrial Average (DJINDICES: ^DJI), benchmark S&P 500 (SNPINDEX: ^GSPC), and innovation-driven Nasdaq Composite (NASDAQINDEX: ^IXIC) all soared to multiple record-closing highs.
But if history teaches investors anything, it’s that the stock market rarely moves up or down in a straight line. Though there’s no such thing as a forecasting tool that can, with 100% accuracy, concretely tell the future and accurately predict short-term directional moves in the Dow Jones, S&P 500, and Nasdaq Composite, it doesn’t stop investors from trying to gain an edge.
One such predictive tool, which thus far, has a perfect track record of correlating with sizable moves in the stock market spanning more than a century, is currently portending a massive move to come in equities.

U.S. M2 money supply did something no one has witnessed in 90 years
The forecasting tool in question that has a flawless track record when back-tested back to 1870 is U.S. money supply.
While there are five different measures of money supply, economists tend to focus on M1 and M2. The former comprises cash and coins in circulation, as well as demand deposits in a checking account. In short, it’s money you can immediately access and spend.
Meanwhile, M2 takes into account everything you’d find in M1 and adds in savings accounts, money market accounts, and certificates of deposit (CDs) below $100,000. This is still money consumers can access and spend, but it requires a little more work to get to. It’s also the money supply measure that’s been blaring a warning for Wall Street.
With few exceptions, M2 money supply slopes up and to the right. This is a fancy way of saying that the amount of capital in circulation tends to increase over time, which is normal and expected, given that the U.S. economy is growing at a relatively steady pace over the long run.
But in those rare instances over the last 154 years when M2 money supply has notably declined, it’s been a look-out-below moment for the U.S. economy and stock market.
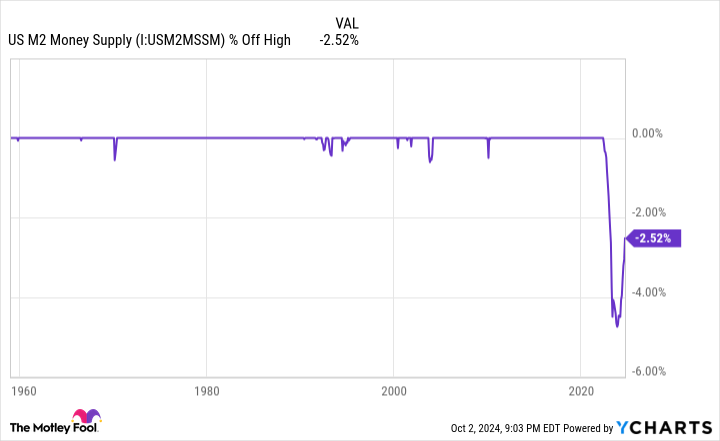
U.S. M2 money supply is reported monthly by the Board of Governors of the Federal Reserve and peaked at $21.722 trillion in April 2022. As of the latest report for August 2024, M2 stood at $21.175 trillion, which is down 2.52% from its all-time high. Last year marked the first year-over-year decline in M2 money supply of at least 2% since the Great Depression.
But as you’ll note from the chart, M2 money supply is once again rising on a year-over-year basis. Despite M2 declining by a peak of 4.74%, as of October 2023, this drop has been nearly halved in less than a year.
Furthermore, even the peak 4.74% drop in M2 from its all-time high pales in comparison to the historic year-over-year increase in M2 money supply of more than 26% registered during the COVID-19 pandemic. Multiple rounds of fiscal stimulus injected capital into the U.S. economy at an otherworldly pace. The decline we’ve witnessed over the last two-plus years may ultimately be a benign reversion to the mean following a historic expansion of U.S. money supply.
Then again, it might represent something more nefarious.
WARNING: the Money Supply is officially contracting. 📉
This has only happened 4 previous times in last 150 years.
Each time a Depression with double-digit unemployment rates followed. 😬 pic.twitter.com/j3FE532oac
— Nick Gerli (@nickgerli1) March 8, 2023
Although the post above from Reventure Consulting CEO Nick Gerli is more than a year old, it highlights a key correlation between year-over-year changes in M2 money supply and the U.S. economy.
Since 1870, there have only been five instances where M2 money supply has declined by at least 2% on a year-over-year basis — 1878, 1893, 1921, 1931-1933, and 2023. The prior four occurrences all correlate with periods of depression for the U.S. economy, as well as a double-digit unemployment rate.
Understand that there’s a pretty big caveat to this historic correlation. Namely, the Federal Reserve didn’t exist in 1878 or 1893, and both the nation’s central bank and federal government had limited knowledge of how to counter steep economic contractions and high unemployment in 1921 and during the Great Depression, when compared to present day. With the knowledge and monetary/fiscal tools now available, a depression would be highly unlikely.
Nevertheless, M2 money supply is still 2.52% below its record high set 28 months prior. A notable decline in M2 suggests that consumers will have to forgo some of their discretionary purchases, which has historically been a recipe for economic weakness, if not a recession.
Based on a study from Bank of America Global Research, around two-thirds of the S&P 500’s peak-to-trough drawdowns occur during, not prior to, recessions being declared. Thus, the historic decline we’ve witnessed in M2 may be signaling a massive move lower to come in stocks.

History differs significantly based on your investment time frame
The prospect of a stock market correction or bear market probably isn’t something the investing community wants to hear about. However, history is a two-sided coin that, in many instances, strongly favors investors with a long-term mindset.
Despite all the well-wishing in the world, recessions are a perfectly normal and inevitable part of the economic cycle. Since the end of World War II, there have been a dozen recessions in the U.S., which works out to a downturn every roughly 6.6 years.
But what’s interesting about recessions is how quickly they resolve. Out of the 12 recessions over the last 79 years, just three surpassed the 12-month mark, and none endured longer than 18 months. Comparatively, most periods of growth have lasted multiple years, with two economic expansions reaching the 10-year mark.
Even though stocks and the U.S. economy aren’t tethered at the hip, a steadily growing economy would be expected to have a positive impact on corporate earnings over time. Earnings growth is a key ingredient to sending stock valuations higher.
This variance in perspective, based on your investment time frame, is also easily identified on Wall Street.
In June 2023, shortly after the S&P 500 was confirmed to be in a new bull market (i.e., had bounced more than 20% from its 2022 bear market low), the researchers at Bespoke Investment Group released the data set you see above on social media platform X. This data set measured the length of every bear and bull market in the S&P 500, dating back to the start of the Great Depression in September 1929.
Whereas the average S&P 500 bear market has endured for 286 calendar days, or roughly 9.5 months, over a 94-year period, the typical bull market has stuck around for 1,011 calendar days, or about two years and nine months.
To add, the longest S&P 500 bear market in history (630 calendar days), which occurred from Jan. 11, 1973 through Oct. 3, 1974, is shorter than 13 out of 27 S&P 500 bull markets. There have been nine bull markets that have ranged from 1,324 calendar days to 4,494 calendar days.
Even without being able to pinpoint ahead of time when stock market corrections will begin, how long they’ll last, or where the ultimate bottom will be, close to a century of history makes it crystal clear that maintaining perspective and being optimistic is a winning formula on Wall Street.
Where to invest $1,000 right now
When our analyst team has a stock tip, it can pay to listen. After all, Stock Advisor’s total average return is 768% — a market-crushing outperformance compared to 167% for the S&P 500.*
They just revealed what they believe are the 10 best stocks for investors to buy right now…
*Stock Advisor returns as of September 30, 2024
Bank of America is an advertising partner of The Ascent, a Motley Fool company. Sean Williams has positions in Bank of America. The Motley Fool has positions in and recommends Bank of America. The Motley Fool has a disclosure policy.
U.S. Money Supply Recently Did Something for the First Time Since the Great Depression — and It May Signal a Massive Move to Come in Stocks was originally published by The Motley Fool